Air clean up
Published over 9 years ago. See the latest and most current information on Air clean up.
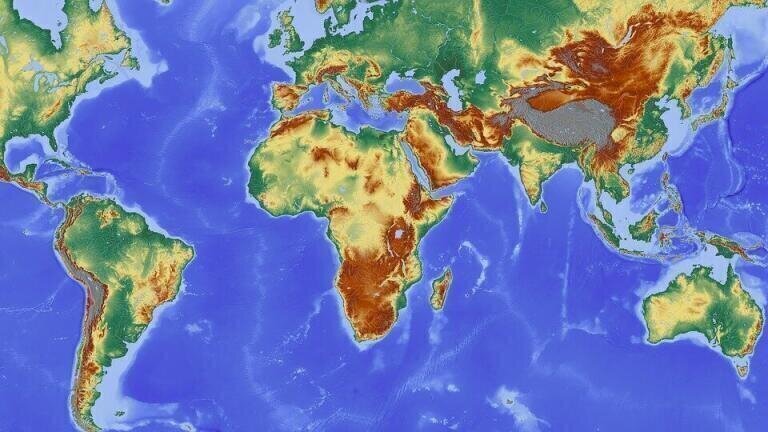
A new interactive, 3D map allows us to see the seriousness of pollution in real-time. Launched by French start-up company AirVisual, the incredible map allows users to revolve the Earth on its axis and assess any part of the globe at the present moment for pollution levels.
The map was released on the 18th November to mark the close of the COP22 summit in Marrakesh, Morocco, which was the follow-up to last year’s climate change talks in Paris. At that particular meeting, rulers from around the world came together to agree on how to curb global warming as much as possible and prevent a world temperature hike of 2°C (keeping any rise preferably below 1.5°C).
AirVisual launched the tool in order to raise awareness about how far short current measures to address climate change are falling by allowing ordinary citizens to see levels of pollution around the globe. Though such technology has been used in an industrial capacity in the past, this is the first map which allows laymen to clearly and easily understand the state of the world’s airways.
The map is colour-coordinated map according to the Air Quality Index (AQI), an American index which assesses particulate matter 2.5 (PM2.5), carbon monoxide (CO), sulphur dioxide (SO2), nitrogen dioxide (NO2) and ground-level ozone (O3). In this manner, it’s easy to see at a mere glance which parts of the world are suffering most from elevated levels of pollution via the red blotches pulsing across the screen.
The map is an important tool in not only allowing everyone to see where pollution is currently, but where it might head next. Swirling arrows on the surface of the Earth indicate wind direction, while wisps of colour straying away from larger splotches indicate how long pollution particles are enduring for and where they’re heading next.
For example, everyone is already well aware of the serious environmental problems plaguing China. Just a few years ago, it emerged that Chinese power plants emit as much NOx as all of the passenger cars in the world and although the Asian superpower has taken steps to address the problem, it remains a huge issue, albeit a well-documented one.
Another cause for concern which perhaps receives less headlines is what happens to this pollution once the wind sweeps it away from China’s bustling cities and industrial hotspots. The trails of green on the map demonstrate where the particles are being driven, whilst also highlighting that they remain in concentrations that are deemed unsafe by the World Health Organisation (WHO).
PM2.5 in particular is regarded as a serious threat to human health due to its ability to be inhaled and infiltrate the bloodstream, causing no end of physical complications to the heart, lungs and other vital organs. The green colours on the map represent levels of up to 50mg/m3, which is higher than WHO safe levels (these stand at 10mg/m3 per year and 25mg/m3 per day).
In addition to viewing world population in real-time, AirVisual’s ingenious tool also allows users to create pollution forecasts for up to three days in over 5,000 cities around the globe. As such, these maps are helping us understand just how serious a problem air quality is – and perhaps how we can tailor our daily habits to minimise our effect on it and its effect on us.


_shutterstock_2296088597.jpg)